


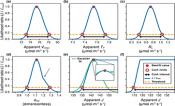
Two cowpea Rubisco activase isoforms for crop thermotolerance
Armida Gjindali, Rhiannon Page, Catherine J. Ashton, Ingrid Robertson, Mike T. Page, Duncan Bloemers, Peter D. Gould, Dawn Worrall, Douglas J. Orr, Elizabete Carmo-Silva
New Phytologist
DOI: /10.1111/nph.70271
Needs and opportunities to future-proof crops and the use of crop systems to mitigate atmospheric change
Stephen P. Long
Philosophical Transactions B
DOI: 10.1098/rstb.2024.0229
Safeguarding crop photosynthesis in a rapidly warming world
Carl J. Bernacchi, Stephen P. Long, Donald R. Ort
Science
DOI: 10.1126/science.adv5413
Widely used variants of the Farquhar-von-Caemmerer-Berry model can cause errors in parameter estimation
Edward B Lochocki , Justin M McGrath
in Silico Plants
DOI: 10.1093/insilicoplants/diaf014
Synthetic Manihot esculenta Rubisco activase proteins with increased thermotolerance identified via machine learning
Clayton Dilks, Rhiannon LaVine, Claire Buchanan, Daniel Russo, and Elizabete Carmo-Silva
microPublication Biology
DOI: 10.17912/micropub.biology.001773
Feeding from the sun—Successes and prospects in bioengineering photosynthesis for food security
Stephen P. Long, Yu Wang, Elizabete Carmo-Silva, Amanda P. Cavanagh, Martin C. Jonikas, Johannes Kromdijk, Benedict M. Long, Amy Marshall-Colon, Diwakar Shukla, Robert H. Wilson, Xin-Guang Zhu, and Elizabeth A. Ainsworth
Cell
DOI: 10.1016/j.cell.2025.10.033
Enhancing plant resilience under combined stress: the role of reflectance spectroscopy
Jiating Li, Peng Fu, Carl J Bernacchi
Journal of Experimental Botany
DOI: 10.1093/jxb/eraf368
Bigger is not always better: Optimizing leaf area index with narrow leaf shape in soybean
Bishal G Tamang, Gregory Bernard, Carl J Bernacchi, Brian W Diers, Elizabeth A Ainsworth
Plant Physiology
DOI: 10.1093/plphys/kiaf663
Shortcutting photorespiration: avenues and challenges toward realizing higher-yielding photorespiratory bypass crops
Katherine Meacham-Hensold, Jooyeon Jeong, Amanda P. Cavanagh, Donald R. Ort
New Phytologist
10.1111/nph.70724
PhotoGEA: An R Package for Closer Fitting of Photosynthetic Gas Exchange Data With Non-Gaussian Confidence Interval Estimation
Edward B. Lochocki, Coralie E. Salesse-Smith, Justin M. McGrath
Plant, Cell and Environment
10.1111/pce.15501
Bioconversion of CO2 into valuable bioproducts via synthetic modular co-culture of engineered Chlamydomonas reinhardtii and Escherichia coli
Nam Kyu Kang, Hyun Gi Koh, Yujung Choi, Hyunjun Min, Donald R. Ort, Yong-Su Jin
Metabolic Engineering
10.1016/j.ymben.2025.03.004
Variation in relaxation of non-photochemical quenchingbetween the founder genotypes of the soybean (Glycine max)nested association mapping population
Dhananjay Gotarkar, Anthony Digrado, Yu Wang, Lynn Doran, Ignacio Sparrow-Munoz, Sarah Chung, Nicholas Lisa, Farwah Wasiq, Gerardo Amaro, Bethany Blakely, Brian W. Diers, Daniel J. Eck and Steven J. Burgess
The Plant Journal
10.1111/tpj.17219