


What can researchers learn about ecosystems and the environment during the total solar eclipse?
Scientists across the U.S. and Mexico are engaging in a one-day data-gathering operation to record how the 2024 total solar eclipse affects various aspects of life on Earth. At the University of Illinois Urbana-Champaign, crop sciences and plant biology professor, and RIPE Deputy Director of Phenotyping, Carl Bernacchi and his colleagues will focus on atmospheric and ecosystem-scale responses to the eclipse. Bernacchi spoke with News Bureau life sciences editor Diana Yates about what is planned and how it fits into the bigger research effort.
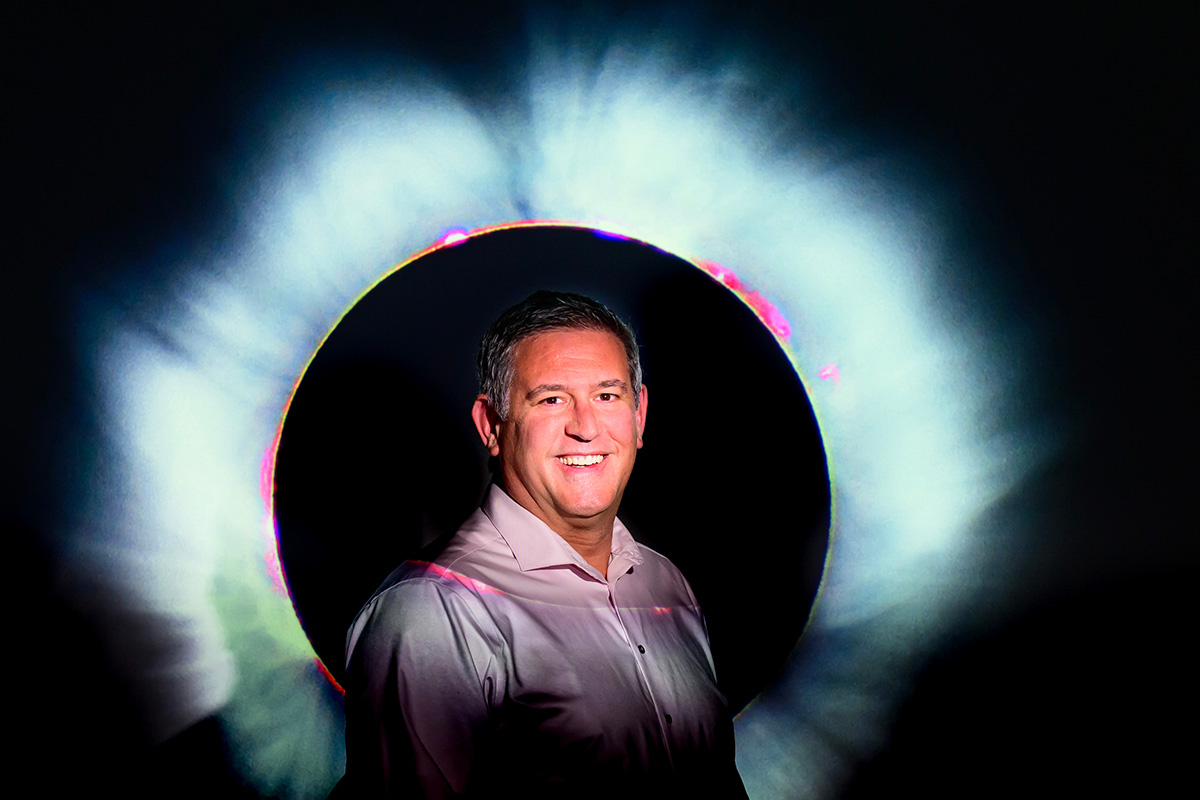
Carl Bernacchi, a professor of crop sciences and of plant biology at the U. of I., describes the coordination of scientific instruments across the U.S. and Mexico that will be used to measure the physical, atmospheric and ecological changes that occur during the 2024 solar eclipse. Photo by Fred Zwicky
Please describe the overall research effort.
In ecosystem sciences, a significant short-term perturbation of the environment offers an excellent opportunity to better understand key physical drivers of biology. Solar eclipses, for example, allow us to investigate how a rapid and extreme change in solar radiation affects the atmosphere, the environment, and ecosystems within them.
Researchers along the shadow’s path have come together to use existing scientific infrastructure to measure how key aspects of the environment change in response to the eclipse and how these changes alter ecosystem functioning
Hundreds of monitoring systems are already in place throughout the world to measure the physical environment and major ecosystem processes. Researchers collecting this data contribute to a global database that promotes opportunity for understanding ecosystems from local to global scales. At the U. of I., we have 10 such systems. These are installed in the university’s experimental fields and in commercial agricultural sites.
The monitoring systems track what ecosystems are doing while also precisely measuring environmental variables such as solar radiation, turbulence, temperature, humidity and wind speed. The variables are critical for tracking ecosystem-atmosphere interactions and understanding ecosystem functioning.
The solar eclipse allows us to conduct a kind of large-scale experiment that would not otherwise be possible. While all the environments under study are inherently variable, there are no opportunities to impose such a significant change across such a vast geography. In this case, the moon is imposing a similar “treatment” across multiple land types in the path of the eclipse.
What kind of monitoring systems are in place at the U. of I.? What data do they collect?
The measurement systems are called eddy covariance towers. The name is derived from “eddy,” the motion of a fluid or gas in response to turbulence; and “covariance,” a statistical approach used to calculate the flux of water, energy, carbon dioxide or other greenhouse gases between the ecosystem and the atmosphere.
The monitoring systems measure wind turbulence and gas concentrations in the atmosphere 10 times per second, every day of the year. Some of these systems have been operating continuously for more than 25 years. Each also includes a meteorological measurement station, which is just like a typical weather station but with more, and more sophisticated, sensors to measure the environment.
These systems have made major contributions to our understanding of the carbon and water cycles in the Midwest and contribute to the understanding of global processes. U. of I. researchers in crop sciences, in plant biology and at the Prairie Research Institute collect data using these techniques in corn, soybeans, prairie plants and bioenergy feedstock ecosystems.
Will the data-collection process change at all during the eclipse? If so, how?
The high-resolution, 10-times-per-second data collection process will not change. But meteorological data is usually collected at 5-to-10-second intervals and averaged to 30-minute values. Given the highly dynamic nature of the solar eclipse, we are adjusting the frequency of the meteorological data-collection process to 1 measurement per second and storing 5-second averages. This will allow us to capture the causes and effects of rapid changes in environmental variables on processes that range from physics to biology.
How do you expect the data to inform future efforts?
Eclipses are rare phenomena, and while they have a dramatic effect on several aspects of the environment and ecosystems, these effects are short-lived. However, perturbing a system is a great way to understand the mechanisms driving that system. Better mechanistic understanding of systems leads to better predictions of how systems will respond to a wide range of future conditions. As an ecosystem scientist, I am excited about learning how the drastic changes from the solar eclipse affect the biology of ecosystems. The goal is to use what we learn to build better ecosystem models. These models are used in everything from predicting crop yields to global carbon cycling.
Have you looked at data from previous eclipses? If so, what did you find?
We were lucky to have data from the 2017 solar eclipse showing significant changes in ecosystem functioning as the moon blotted out the sun. But a grassroots network of researchers was not as well focused to build an international effort to collect data at higher resolution. Seeing the 2017 eclipse as an opportunity lost, researchers worked hard to ensure a more coordinated effort this time. In addition, our sensing technologies are always improving, so our capabilities today are much better today than they were seven years ago.
Where will the national data be preserved? Will it be available to the public?
Every researcher using the eddy covariance technique is investigating their own research questions. Most, however, also contribute their data to a large, international "Fluxnet" database., which makes the data available to anyone in the world for free. This resource includes data going back several decades, and one of the oldest sites to contribute is at the U. of I.
While there is a lot of interest in what this data will provide, I am mostly excited about adding our data to a global database that will be available to scientists from a wide range of disciplines.